Wednesday, May 22, 2013

Blender animation visualizer in Processing using XML (data visualization from XML files) Part 2

I did a different visualization of a Blender animation in a 'point cloud' representation in 3D. I divided the screen in two, one for the 3d world, and other for the frame slider.

To run the code below, you'll need a XML file inside the data folder of the processing sketch, as we did in the previous post.

To move inside the 3D world, left-click and move, to zoom, right-click and move


//http://creativec0d1ng.blogspot.com.br/ by Italo Travenzoli


import java.awt.Frame; //import Frame
import java.awt.BorderLayout; //import Border Layout
import controlP5.*; //import proxml library
private ControlP5 cp5; //import controlP5 library
ControlFrame cf; // create a control frame object


import peasy.*; //import Peasy library
PeasyCam cam;


import proxml.*; //import proxml library


//xml element to store and load the data of the xml

XMLElement Animation;
XMLElement Object;
XMLElement frame;
XMLElement framePointer;
XMLElement position;
XMLElement positionPointer;
XMLElement rotation;
XMLElement rotationPointer;


XMLInOut xmlInOut;


float posX, posY, posZ; // float variables for positions 
String objName; // string variables for object name


int frameSelector = 0; //variable to select frames, initialized with the 0 position
int frameSelectorConstrain; ///constrained variable to select frames
int objectSelector = 0; //variable to select objects, initialized with the 0 position


int numFrames=0; //variable to count the number of frames in the animation, initialized with the 0 position

int numObjects=0; //variable to count the number of objects in the scene, initialized with the 0 position

float [] pointCloudX; //array of floats (x positions of points in the cloud)
float [] pointCloudY; //array of floats (y positions of points in the cloud)
float [] pointCloudZ; //array of floats (z positions of points in the cloud)


float varYMap; //float variable to map the y variation


void setup() {
  size(600, 350, P3D); //size & p3d render

  cam = new PeasyCam (this, 1000);
  //cam.setMinimumDistance(1000);
  cam.setMaximumDistance(5000);

  xmlInOut = new XMLInOut(this);
  try {
    xmlInOut.loadElement("data.xml");
  }
  catch(Exception e) {
    //if the xml file could not be loaded it has to be created
    // xmlEvent(new XMLElement("Animation"));
  }


  //controls

  cp5 = new ControlP5(this); //new ControlP5 object
  cf = addControlFrame("extra", 400, 150); //new Control Frame object - secondary window - (name, width, height)


  numObjects = (Animation.countChildren()-1); //define numObjects with the number of childrens of the 'Animation' tag
  numFrames= (Object.countChildren()-1); //define numFrames with the number of childrens of the 'Object' tag


  pointCloudX= new float [numFrames]; //create an float array with the size of number of frames
  pointCloudY= new float [numFrames]; //create an float array with the size of number of frames
  pointCloudZ= new float [numFrames]; //create an float array with the size of number of frames

  
}

void xmlEvent(XMLElement element) {
  Animation = element; //define the Animation element as the element (first tag of XML)
  Object = Animation.getChild(0); //define the Object element as the -first- child of Animation tag in position 0 (the first object of the xml file)

}

void draw() {
  background(255); //white bg
  frameSelectorConstrain = constrain(frameSelector, 0, (Object.countChildren()-2)); // constrain frame selector


  for (int a = 0; a< numObjects; a++) { // for all objects in scene
    Object = Animation.getChild(a); //get objects
    objName  =(Object.getAttribute("name")); //get objects names
      
    for (int b=0; b<numFrames;b++) { // for all frames
      
      
      framePointer = Object.getChild(b); //get frame in context
      positionPointer = framePointer.getChild(0); //read _position as first child of _frame
      rotationPointer = framePointer.getChild(1); //read _rotation as second child of _frame


      pointCloudX[b] = positionPointer.getFloatAttribute("posX"); //read attribute 'posX' as float
      pointCloudY[b] = positionPointer.getFloatAttribute("posY"); //read attribute 'posY' as float
      pointCloudZ[b] = positionPointer.getFloatAttribute("posZ"); //read attribute 'posZ' as float
      fill(255, 0, 0); //red fill
      stroke(255,0,0); //red stroke
      
   
      //draw points (to represent position in time)
      pushMatrix();
      stroke(255,0,0); //red stroke
      strokeWeight(5); //stroke weight 5
      translate(pointCloudX[b]*100, pointCloudZ[b]*-100, pointCloudY[b]*100); //translate each point to the position of the objects in scene (*100, because the values are too low)
      point(0,0); //draw point
      popMatrix();
      
    // draw lines (to represent rotation in time)
      pushMatrix();
      pushStyle();
      stroke(0,0,255); //blue stroke
      strokeWeight(1); //stroke weight 2
      translate(pointCloudX[b]*100, pointCloudZ[b]*-100, pointCloudY[b]*100);  //translate each line to the position of the objects in scene (*100, because the values are too low)
      rotateX(radians(rotationPointer.getFloatAttribute("rotX")*100)); //rotate x
      rotateY(radians(rotationPointer.getFloatAttribute("rotY")*100)); //rotate y
      rotateZ(radians(rotationPointer.getFloatAttribute("rotZ")*100)); //rotate z
      line(0,0,0,-30); //draw line
      popStyle();
      popMatrix();
      
    }
    

      //draw point of the selected frame
      pushMatrix();
      stroke(0,255,0); //green stroke
      strokeWeight(8); //stroke weight 8
      translate(pointCloudX[frameSelectorConstrain]*100, pointCloudZ[frameSelectorConstrain]*-100, pointCloudY[frameSelectorConstrain]*100); //translate each point to the position of the objects in scene (*100, because the values are too low)
      point(0,0); //draw point
      popMatrix();
      //draw text
      pushMatrix();
      fill(255,0,0);
      translate(pointCloudX[0]*100, pointCloudZ[0]*-100, pointCloudY[0]*100); //translate each object name to the position of the objects in scene (*100, because the values are too low)
      textSize(20); // text size 20
      text(objName, 20, 20); //draw text with offset of 20 pixels 
      popMatrix();
     
      
  }

//draw world box
  noFill();
  stroke(150);
  strokeWeight(2);
  box (700);
}


ControlFrame addControlFrame(String theName, int theWidth, int theHeight) {
  Frame f = new Frame(theName);
  ControlFrame p = new ControlFrame(this, theWidth, theHeight);
  f.add(p);
  p.init();
  f.setTitle(theName);
  f.setSize(p.w, p.h);
  f.setLocation(100, 100);
  f.setResizable(false);
  f.setVisible(true);
  return p;
}


// the ControlFrame class extends PApplet, so we 
// are creating a new processing applet inside a
// new frame with a controlP5 object loaded
public class ControlFrame extends PApplet {

  int w, h;

  int abc = 100;

  public void setup() {
    size(w, h);
    frameRate(25);
    cp5 = new ControlP5(this);

//create sliders

//slider to select frame
    numFrames=(Object.countChildren()-1);
    cp5.addSlider("frameSelector")
      .setPosition(20, 20)
        .setWidth(200)
        .setHeight(50)
          .setRange(0, numFrames) // values can range from big to small as well
            .setValue(0)
              //.setSliderMode(Slider.FLEXIBLE)
              .plugTo(parent, "frameSelector")
                ;
    frameSelector = constrain(frameSelector,0,Object.countChildren()-1);
    /*
    cp5.addSlider("abc").setRange(0, 255).setPosition(10,10);
     cp5.addSlider("def").plugTo(parent,"def").setRange(0, 255).setPosition(10,30);
     */
  }

  public void draw() {
    background(255);

    fill(0);
    pushMatrix();


    textSize(20);
    text("frame: "+frameSelector, 20, 100);
    popMatrix();


  }

  private ControlFrame() {
  }

  public ControlFrame(Object theParent, int theWidth, int theHeight) {
    parent = theParent;
    w = theWidth;
    h = theHeight;
  }


  public ControlP5 control() {
    return cp5;
  }


  ControlP5 cp5;


  Object parent;

}

Saturday, May 18, 2013

Blender animation visualizer in Processing using XML (data visualization from XML files) Part 1

The lesson today is about data visualization in Processing using XML as a data base, and we'll achieve data from animated objects in Blender, using a script to generate a txt file.

First, we need data.

In Blender, you can animate characters using controllers, that could be meshes, curves, etc. If you only animate a character by grabbing, rotating and scaling controllers, you could get accurate data analyzing those controllers transformations.

It's possible to read the bones (actually pose-bones) rotation data, but in this case we'll focus in the controllers transformations.

How do you export data from Blender?
- By using python scripts in the Text Editor panel.

 Your objects are in the center panel (3D View), and, on the right side panel, the Text Editor

To store data, you need data first. Create a scene with different objects (meshes, curves, etc), and animate them by grabbing and rotating. If you don't know how to add objects and keyframes, ask mr. Google. It's not the objective of this post to teach how to use Blender.

Try to understand the code reading the comments (in python coments are after "#" and in processing is after "//")

If you already have animated objects,  you can add the following python script to the Text Editor:

#http://creativec0d1ng.blogspot.com.br/ by Italo Travenzoli 

import bpy

import os


main_path = os.getcwd() #define the main path to the current working directory of a process.

print("writing to: " + main_path + "\n\n") #print the path to the console

outfile = os.path.join(main_path, 'test.txt') #define the out file by using the main_path variable and the name of the file

outfile = open('test.txt', 'w') #open the file to write on it

sce = bpy.context.scene #get the current scene


#writes the txt file

with open('test.txt', 'w') as outfile:


    outfile.write("<Animation>\n") #write the first open tag

    for objects in bpy.data.objects: #for each object in the scene...

        ob = bpy.data.objects[objects.name] #the ob variable is set as the object in context

        outfile.write("<Object name=\"" + ob.name + "\">\n") #write the next tag Object with the parameter name, that'll be filled with the object name

        for frame in range(sce.frame_end + 1): #for each frame in the range of frames of the animation

            sce.frame_set(frame) #set the frame of the scene as the frame in context

            posx = ob.location[0] #get the position in X of the object in context

            posy = ob.location[1] #get the position in Y of the object in context

            posz = ob.location[2] #get the position in Z of the object in context

            rotx = ob.rotation_euler[0] #get the rotation in X of the object in context

            roty = ob.rotation_euler[1] #get the position in Y of the object in context

            rotz = ob.rotation_euler[2] #get the position in Z of the object in context

            outfile.write("<frame id=\"" + str(frame)+ "\">\n") #write the next tag "frame" with the parameter "id"


            #pos

            outfile.write("<position ") #write the next tag "position"

            outfile.write("posX=\"" + str(posx) + "\" ") #write the position in X of the object in context as a parameter

            outfile.write("posY=\"" + str(posy) + "\" ") #write the position in Y of the object in context as a parameter

            outfile.write("posZ=\"" + str(posz) + "\" ") #write the position in Z of the object in context as a parameter

            outfile.write("/>\n") #close the tag "position" and break the line


            #rot

            outfile.write("<rotation ") #write the next tag "rotation"

            outfile.write("rotX=\"" + str(rotx) + "\" ")  #write the rotation in X of the object in context as a parameter

            outfile.write("rotY=\"" + str(roty) + "\" ") #write the rotation in Y of the object in context as a parameter

            outfile.write("rotZ=\"" + str(rotz) + "\" ") #write the rotation in Z of the object in context as a parameter

            outfile.write("/>\n") #close the tag "rotation" and break the line


            outfile.write("</frame>\n") #close the tag "frame" and break the line

        outfile.write("</Object>\n") #close the tag "Object" and break the line

    outfile.write("</Animation>\n") #close the tag "Animation" and break the line


outfile.close() #close the file

Run the script!!

This script genetates a .txt file with all the positions and rotations of each object in each frame.

Open the generated "test.txt" file and put a line above everything:
<?xml version="1.0" encoding="ISO-8859-1"?> 
Save as a XML file, with "data.xml" name.

Now you are able to visualize it with Processing. I used Processing 2.0b8 with controlP5 and proXML libraries.

Create a Processing sketch, save, and, inside of the sketch folder, create a "data" folder. Paste the  "data.xml" inside of it.

//http://creativec0d1ng.blogspot.com.br/ by Italo Travenzoli


import proxml.*; //import proxml library


import controlP5.*; //import controlP5 library


ControlP5 cp5; //define a ControlP5 object


Slider abc; //define a abc slider object


float posX, posY, posZ; //float variables for positions


String objName; // string variable for object name


int frameSelector = 0; //variable to select frames, initialized with the 0 position


int objectSelector = 0; //variable to select objects, initialized with the 0 position


int numFrames=0; // //variable to count the number of frames in the animation, initialized with the 0 position


float [] pointsX; //array of floats (x positions)


float [] pointsY; //array of floats (y positions)


float varYMap; //float variable to map the y variation


//xml element to store and load the data of the xml


XMLElement Animation;


XMLElement Object;


XMLElement frame;


XMLElement framePointer;


XMLElement position;


XMLElement positionPointer;


XMLElement rotation;


XMLElement rotationPointer;


XMLInOut xmlInOut;


void setup() {


  size(600, 350); //size


  xmlInOut = new XMLInOut(this);


  try {


    xmlInOut.loadElement("data.xml"); //load the data.xml file


  }


  catch(Exception e) {


    //if the xml file could not be loaded it has to be created


    // xmlEvent(new XMLElement("Animation"));


  }


  //controls


  cp5 = new ControlP5(this); //new ControlP5 object


  // add a horizontal sliders, the value of this slider will be linked


  // to variable 'sliderValue' 


  cp5.addSlider("objectSelector") //slider to select the object


    .setPosition(50, 25)


      .setWidth(200)


        .setRange(0, (Animation.countChildren()-1)) // set the range of the slider by achieving the number of objects in the scene


          .setValue(0)


            .setSliderMode(Slider.FLEXIBLE)


              ;


// use Slider.FIX or Slider.FLEXIBLE to change the slider handle


// by default it is Slider.FIX


numFrames=(Object.countChildren()-1); //variable that receives the number of frames in the scene


  cp5.addSlider("frameSelector") //slider to select the frame


    .setPosition(50, 50)


      .setWidth(400)


        .setRange(0, numFrames) // set the range of the slider by achieving the number of frames in the scene


          .setValue(0)


            .setSliderMode(Slider.FLEXIBLE)


              ;


  pointsX= new float [numFrames]; //create the array for x positions by defining its size with the number of frames


  pointsY= new float [numFrames]; //create the array for y positions by defining its size with the number of frames


}


void xmlEvent(XMLElement element) {


  Animation = element; //define the Animation element as the element (first tag of XML)


  Object = Animation.getChild(0); //define the Object element as the -first- child of Animation tag in position 0 (the first object of the xml file)


}


void draw() {


  background(150); //gray bg


  fill(0); //black fill


  Object = Animation.getChild(objectSelector); //Define the object in context by receiving the data from the objectSelector slider


  objName =(Object.getAttribute("name")); //get the name of the object in context


  frame = Object.getChild(frameSelector); //Define the frame in context by receiving the data from the frameSelector slider


  position = frame.getChild(0); //reach the position tag as the first child of the frame tag


  rotation = frame.getChild(1); //reach the rotation tag as the second child of the frame tag


  posX = position.getFloatAttribute("posX");  //define the posX variable by getting the float value of the posX attribute


  posY = position.getFloatAttribute("posY"); //define the posY variable by getting the float value of the posY attribute


  posZ = position.getFloatAttribute("posZ");   //define the posZ variable by getting the float value of the posZ attribute


//write text on screen


  textSize(20);


  text("object: "+ objName, 50, 100);


  text("frame: "+frameSelector, 50, 150);


  text("posX: "+ posX, 50, 200);


  text("posY: "+posY, 50, 250);


  text("posZ: "+posZ, 50, 300);


  //graph


 //get all the values of positions in every frame of the object in context and store in the array


  for (int i=0; i<numFrames;i++) {


    framePointer = Object.getChild(i);


    positionPointer = framePointer.getChild(0);


    rotationPointer = framePointer.getChild(1);


    pointsX[i] = positionPointer.getFloatAttribute("posX");


    pointsY[i] = positionPointer.getFloatAttribute("posY");


  }


//draw the graph - explained in details here: http://creativec0d1ng.blogspot.com.br/2012/11/graphs-and-processing.html


//draw a lighter gray rect to serve as frame for the graph


  fill(180);


  noStroke();


  rect(width/2-10, height/2-100+50, 295, 200);


  int ponto1x=width/2;


  int ponto1y=height/2+50;


  int ponto2x=width-20;


  int ponto2y=height/2+50;


  PVector [] pontos = new PVector [numFrames];


  PVector [] var = new PVector [numFrames];


  for (int i=0;i<numFrames;i++) {


    pontos[i] = new PVector (0, 0, 0);


    var [i] = new PVector (0, 0, 0);


  }


  noFill();


  stroke(255, 0, 0);


  strokeWeight(2);


  beginShape();


  for (int i=0;i<numFrames;i++) {


    float X=(lerp(ponto1x, ponto2x, i/float(numFrames)));


    float Y=(lerp(ponto1y, ponto2y, i/float(numFrames)));


    pontos[i].set(X, Y, 0);


    var[i].set(0, map(pointsY[i]-pointsY[0], 0, 2, 0, 100), 0);


    pontos[i].add(var[i]);


    vertex(pontos[i].x, pontos[i].y);


  }


  endShape();


  fill(255, 0, 0);


  frameSelector = constrain(frameSelector, 0, numFrames-1);


  ellipse(map(frameSelector, 0, numFrames, ponto1x, ponto2x), height/2+50+map(pointsY[frameSelector]-pointsY[0], 0, 2, 0, 100), 10, 10);


} 


Ta dah!


Monday, April 8, 2013

Blogging Hiatus

Hey everyone, I'm really busy these days whith my master's degree project, but after day 18 of this month I'll be back.


Sorry :(

Thursday, January 31, 2013

Glitch brush


Hello!


/* Glitch brush
 http://creativec0d1ng.blogspot.com.br/ by Italo Travenzoli

press "s" to save image
press "e" to erase
press "g" to glitch
 */
  int N=0;


void setup(){

size (851,315);

frameRate(60);

smooth();

colorMode(HSB);

background(255);

}


void draw(){


  if(keyPressed){

    if (key== 's'||key=='S'){

      save("image.jpg");

    }

    if (key== 'e'||key=='E'){

      background (255);

    }
   if (key== 'g'||key=='G'){
 
      Set();
 
    }     

  }


  if(mousePressed){

    float strokeSize = random(5,25);

    noStroke();

    rectMode(CENTER);

    fill(random(360),300,300);

     if(frameCount%2==0){
    rect (mouseX,mouseY,strokeSize,strokeSize);
 }
    if(frameCount%2!=0){
    ellipse (mouseX,mouseY,strokeSize,strokeSize);
 }

  }


}


int r(int a){

  return int(random(a));

}

/* 

void mouseReleased (){

  N++;

  save("glitchCover"+ (N)+".tif");

}

 */

void Set() {

  for (int i=0; i<10; i++) {

    int x = r(width);

    int y = r(height);

    set((x+r(50)-1)*int(random(-10,10)),y+r(3)-1,get(x,y,r(99),r(30)));

  }

}


Saturday, January 19, 2013

How to get frequency values from mic with Processing and Minim library


(test with this video: http://youtu.be/4G60hM1W_mk)

The idea is to get the frequency of the volume peak

import ddf.minim.*;
import ddf.minim.analysis.*;

Minim minim;
AudioInput in;
FFT fft;
String note;// name of the note
int n;//int value midi note
color c;//color
float hertz;//frequency in hertz
float midi;//float midi note
int noteNumber;//variable for the midi note


int sampleRate= 44100;//sapleRate of 44100

float [] max= new float [sampleRate/2];//array that contains the half of the sampleRate size, because FFT only reads the half of the sampleRate frequency. This array will be filled with amplitude values.
float maximum;//the maximum amplitude of the max array
float frequency;//the frequency in hertz

void setup()
{
  size(400, 200);

  minim = new Minim(this);
  minim.debugOn();
  in = minim.getLineIn(Minim.MONO, 4096, sampleRate);
  fft = new FFT(in.left.size(), sampleRate);
}

void draw()
{

  background(0);//black BG

  findNote(); //find note function

  textSize(50); //size of the text

  text (frequency-6+" hz", 50, 80);//display the frequency in hertz
  pushStyle();
  fill(c);
  text ("note "+note, 50, 150);//display the note name
  popStyle();
}

void findNote() {

  fft.forward(in.left);
  for (int f=0;f<sampleRate/2;f++) { //analyses the amplitude of each frequency analysed, between 0 and 22050 hertz
    max[f]=fft.getFreq(float(f)); //each index is correspondent to a frequency and contains the amplitude value 
  }
  maximum=max(max);//get the maximum value of the max array in order to find the peak of volume

  for (int i=0; i<max.length; i++) {// read each frequency in order to compare with the peak of volume
    if (max[i] == maximum) {//if the value is equal to the amplitude of the peak, get the index of the array, which corresponds to the frequency
      frequency= i;
    }
  }


  midi= 69+12*(log((frequency-6)/440));// formula that transform frequency to midi numbers
  n= int (midi);//cast to int


//the octave have 12 tones and semitones. So, if we get a modulo of 12, we get the note names independently of the frequency  
if (n%12==9)
  {
    note = ("a");
    c = color (255, 0, 0);
  }

  if (n%12==10)
  {
    note = ("a#");
    c = color (255, 0, 80);
  }

  if (n%12==11)
  {
    note = ("b");
    c = color (255, 0, 150);
  }

  if (n%12==0)
  {
    note = ("c");
    c = color (200, 0, 255);
  }

  if (n%12==1)
  {
    note = ("c#");
    c = color (100, 0, 255);
  }

  if (n%12==2)
  {
    note = ("d");
    c = color (0, 0, 255);
  }

  if (n%12==3)
  {
    note = ("d#");
    c = color (0, 50, 255);
  }

  if (n%12==4)
  {
    note = ("e");
    c = color (0, 150, 255);
  }

  if (n%12==5)
  {
    note = ("f");
    c = color (0, 255, 255);
  }

  if (n%12==6)
  {
    note = ("f#");
    c = color (0, 255, 0);
  }

  if (n%12==7)
  {
    note = ("g");
    c = color (255, 255, 0);
  }

  if (n%12==8)
  {
    note = ("g#");
    c = color (255, 150, 0);
  }
}

void stop()
{
  // always close Minim audio classes when you are done with them
  in.close();
  minim.stop();

  super.stop();
}

Friday, January 18, 2013

Procedural texture


I wanted to create a new cover for my twitter, so I used code to make a procedural texture. I want to share the code:

float [] sizeX= new float [10000];
float [] sizeY= new float [10000];

void setup(){
  size (700,400);
  colorMode(HSB);
  
   for(int i=0; i<2000;i++){
     for(int j=0; j<2000;j++){
       sizeX[i]=random (5,50);
       sizeY[i]=random (5,50);
    }
  }
}

void draw (){
  background (0);
  if(mousePressed){
      for(int i=0; i<2000;i++){
    for(int j=0; j<2000;j++){
   sizeX[i]=random (5,50);
   sizeY[i]=random (5,50);
      }
    } 
  }
  for(int i=0; i<2000;i+=20){
    for(int j=0; j<2000;j+=20){
      //noStroke();
      rectMode(CENTER);
      fill(i%360,300,300,i%50);
      rect (i,j,sizeX[i+j],sizeX[i+j]); 
      fill(255);
      //ellipse (i,j,2,2);  
    }
  }
  if(keyPressed){
    if (key== 's'||key=='S'){
      save("image.jpg");
    }
  }
  else{
   text("Press 's' to save image, click to generate new texture", 30,30); 
   text("PS. Don't worry, this text will desapear when you hit the key", 30,50);
  }
}

With few changes in the code, the result changes radically,

Wednesday, December 26, 2012

Classes on Processing

I wish i'd had the explanation I'll give about classes on Processing when I was learning for the first time...

I reunite the basic information you need to understand classes below:

A class is the basis of the object-oriented programming: "A class is a blueprint or prototype from which objects are created." And, for instance, an object is "a software bundle of related state and behavior. Software objects are often used to model the real-world objects that you find in everyday life". (http://docs.oracle.com/javase/tutorial/java/concepts/index.html).

"A class is a composite of fields (data) and methods (functions that are a part of the class) which may be instantiated as objects. The first letter of a class name is usually uppercase to separate it from other kinds of variables". (http://processing.org/reference/class.html)

Now, I'll show how to create a Class, and an array of objects.

cuBEEc

A cubic bee

Fist of all, you need to create the class and the constructor:

class Bee { //The first letter must be UperCase
//declare the variables we'll need, or the properties
int angle; //angle that rotates the wings
int factor=30; //a crazy variable that I used to control the frequency of the wings
float posX, posY,posZ; //variables for the position of the bee


  Bee () {  //constructor

  } 


} 
 
And then, create functions and methods
class Bee { 
int angle;
int factor=30;
float posX, posY,posZ;


  Bee () {  
 
  } 
 void update(){ //function that updates the rotation of the wings
    angle+=factor;
  if(angle>80){
    factor=factor*-1;
  }
   if(angle<0){
     factor=factor*-1;
   }
   
 }
 
 void render(float x, float y,float z){ //function that draws the bee, receiving the parameters like position in x,y, and z axis;
  
  posX=x;
  posY=y; 
  posZ=z;
   

//rectangles and triangles that creates the bee
  pushMatrix();  
  noStroke();
  translate(posX,posY+30,posZ);
  pushMatrix();
  translate(15,0);
  pushMatrix();
  rotate(radians(angle));
  fill(80,180);
  rect(0,0,-30,8);
  popMatrix();
  pushMatrix();
  rotate(radians((angle)*-1));
  rect(0,0,30,8);
  popMatrix();
  
  popMatrix();
  fill(220,220,0);
  quad(30,0,35,5,35,25,30,30);
  fill(255,255,0);
  rect(0,0,30,30);
  fill(0);
  triangle(35,10,40,15,35,20);
  triangle(8,30,13,30,13,35);
  triangle(17,30,22,30,17,35);
  fill(0);
  rect(25,0,5,30);
  rect(0,0,5,30);
  popMatrix();
 } 
} 
Now, you have to declare and initialize the class:

int numBees=1;//number of bees
 Bee [] b = new Bee[numBees]; //an array of bees

 
 void setup() {
  size(1200,700,OPENGL);//size of the screen, using OpenGl rendering for Z axis translation

  frameRate(60);//frame rate of 60 frames per second
 
//using a "for" function to initialize all the bees 
 for (int i=0;i<numBees;i++){
    b[i]= new Bee ();

 }
 
 void draw(){
background(255);//white background

//a "for" function to call the functions of the class for all the bees
    for (int i=0;i<numBees;i++){
      b[i].update();//update wings rotation
    b[i].render(width/2,height/2,300); //draw the bees at the given positions (x,y,z)
  } 
   
 } 
I used this class to create a flocking of animated bees. But if you want a simpler way to move the bees randomly like insects, you can use perlin noise...

Monday, November 26, 2012

Processing glitch camera


<Running with Processing 1.5.1!!>


//glitch camera still generator
//click to save image
 
import processing.video.*;
 
Capture cam;
 
int N=0;
 
void setup(){
size (851,315);
background(255);
colorMode(HSB);
 
 
// If no device is specified, will just use the default.
  cam = new Capture(this, 851, 315);
 
  // To use another device (i.e. if the default device causes an error),  
  // list all available capture devices to the console to find your camera.
  //String[] devices = Capture.list();
  //println(devices);
   
  // Change devices[0] to the proper index for your camera.
  //cam = new Capture(this, width, height, devices[0]);
 
  // Opens the settings page for this capture device.
  //camera.settings();
}
 
void draw(){
 
  Set();
    if (cam.available() == true) {
      if(frameCount==2||frameCount%150==0){
    cam.read();
    image(cam, 0, 0);
    // The following does the same, and is faster when just drawing the image
    // without any additional resizing, transformations, or tint.
    set(width, height, cam);
     for (int i=0; i<100;i++){
       noStroke();
    fill(random(0,360),300,300,100);
    rect ((random (0, width)),(random (0, height)),(random (0,50)),(random(0,50)));
    
  }
      }
  }


}
 
int r(int a){
  return int(random(a));
}
 
void mouseReleased (){
  N++;
  save("glitchCamera"+ (N)+".tif");
}
 
void Set() {
  for (int i=0; i<10; i++) {
    int x = r(width);
    int y = r(height);
    set(x+r(50)-1,y+r(3)-1,get(x,y,r(99),r(30)));
  }
}

Sunday, November 25, 2012

Facebook glitch cover generator made with Processing

//FaceBook glitch cover generator
//click to save image

int N=0;

void setup(){
size (851,315);
background(255);
}

void draw(){
  
  Set();
  Glitch(); 

}

int r(int a){
  return int(random(a));
}

void mouseReleased (){
  N++;
  save("glitchCover"+ (N)+".tif");
}

void Set() {
  for (int i=0; i<10; i++) {
    int x = r(width);
    int y = r(height);
    set(x+r(50)-1,y+r(3)-1,get(x,y,r(99),r(30)));
  }
}

void Glitch() {
  if (frameCount%(r(250)+1) == 0) {
    int lineDensity = int(noise(frameCount)*width);
    for (int i=0; i<width*1.5; i+=lineDensity) {
      stroke(random(0, 255),random(0, 255),random(0, 255));
      strokeWeight(random(1,50));
      line(-100,i,i,-100);
    }
  }
}

Thursday, November 8, 2012

Midi to waveform representation in Processing


Here I'll show how to convert midi notes to frequency, and how to show that frequency with a sine wave


//click on the note numbers to get the respective frequency 
  
float hertz;
  
int noteNumber;//variable for the midi note
  
int xspacing = 5;   // How far apart should each horizontal location be spaced
  
int w;              // Width of entire wave


int theta = 0;  // Start angle at 0
  
float ampl;  // Height of wave
  
float period = 100.0;  // How many pixels before the wave repeats
  
float dx;  // Value for incrementing X, a function of period and xspacing
  
float[] yvalues;  // Using an array to store height values for the wave


void setup() {
  
  size(640, 360);
  
  w = width+16;
  
  dx = (TWO_PI / period) * xspacing;
  
  yvalues = new float[w/xspacing];
  
}


void draw() {
  
  background(0,0,255);


  float startPointX = width/2; //define the X position of the start point in the center of the screen;
  
  float startPointY = height/2; //define the Y position of the start point in the center of the screen;
  
  float endPointX=mouseX; //define the X position of the end point that will follow the mouse;
  
  float endPointY=mouseY; //define the Y position of the end point that will follow the mouse;


  float deltaX=mouseX-width/2; //create a variable with the delta of the x component of the ending - start point
  
  float deltaY=mouseY-height/2; //create a variable with the delta of the y component of the ending - start point
  
  float angleInRadians=atan2(deltaY,deltaX); //get the angle in radians between them with atan2()


  PVector[]points=new PVector[100]; //create an array of vectors that will store the flat positions of points that will create the graph with the number of elements equal to the size of the of the arraylist
  
  PVector[]amplitude = new PVector[100]; //create an array of vectors that will store the amplitude of the mapped mouse with the number of elements equal to the size of the of the arraylist


//initalize each vector with x=0 and y=0 values;
  
  for(int a=0; a<100-1; a++){
  
    points[a] = new PVector(0,0,0);
  
    amplitude[a] = new PVector(0,0,0);
  
  }


  //here the magic begins


//we will create a line made of vertex, and each vertex will receive the values of the vectors


textSize(28);
  
fill(255);
  
text("60",30,40);
text("69",width-60,40);
text("100",30,height-40);
text("127",width-60,height-40);
  
text("hertz "+hertz,width-300,height/2+100);


if(mousePressed){
  
  if((mouseX>10&&mouseX<50) && (mouseY>10&&mouseY<60)){
  
    noteNumber=60;
  
  }
  
  if((mouseX>width-80&&mouseX<width) && (mouseY>10&&mouseY<60)){
  
    noteNumber=69;
  
  }
  
   if((mouseX>10&&mouseX<50) && (mouseY>height-70&&mouseY<height)){
  
    noteNumber=100;
  
  }
  
    if((mouseX>width-80&&mouseX<width) && (mouseY>height-70&&mouseY<height)){
  
    noteNumber=127;
  
  }
  
  
}
  
println("noteNumber "+ noteNumber);
  
//convert midi to frequency
  
    
hertz = ( 440*pow(2,((noteNumber-69)/12.0))) ;
println("hertz "+ hertz);


  ampl=20;//aplitude of 20px


  // For every x value, calculate a y value with sine function


  for (int i = 0; i < 100-1; i++) {
 
    
    theta += int(hertz);
   theta+=int(dx);
   if(theta%1000==0){//reset theta
     theta=0;
   }
   
    yvalues[i] = sin(theta)*ampl;
  
   println(theta);  
  
  }


  beginShape();
  
  noFill(); //no fill
  
  stroke(255); // white stroke
  
  strokeWeight(2); //2 px stroke


  for(int i = 0; i<100-1;i++){


  float X=lerp(startPointX,endPointX,i/float(99)); // create a linear interpolation between the start and the end point of the X component, and the amount of interpolation will cover the entire interval;
  
  float Y=lerp(startPointY,endPointY,i/float(99));  // create a linear interpolation between the start and the end point of the Y component, and the amount of interpolation will cover the entire interval;
  
  amplitude[i].set(0,(yvalues[i]),0); //set each vertex of the aray with the amplitude of the graph, acquiring the data of the buffer
  
  rotate2D(amplitude[i],angleInRadians); //rotate the vector of amplitude acordingly to the angle between the start and end points


  points[i].set(X,Y,0); //set each vertex of the array with the correspondent value of the interpolation, creating a flat line
  
  points[i].add(amplitude[i]); //add the amplitude vector to the flat line of vectors, creating a 2D graph


  vertex (points[i].x,points[i].y); //draw each vertex with the values (coordinates) of the vertex
  
  }
  
  endShape();


  //draw the ellipses with the positions of the startpoint and endpoint
  
  float diam=40;
  
  fill(255);
  
  ellipse(startPointX,startPointY,diam,diam);
  
  ellipse(endPointX,endPointY,diam,diam);


}
  
  
//A function that rotates the vector


void rotate2D(PVector v, float angle) {
  
  // What's the magnitude?
  
  float m = v.mag();
  
  // What's the angle?
  
  float a = v.heading2D();


  // Change the angle
  
  a += angle;


  // Polar to cartesian for the new xy components
  
  v.x = m * cos(a);
  
  v.y = m * sin(a);
  
}

Tuesday, November 6, 2012

Dynamic waveform representation in Processing

I'll show how to use the method of the previous tutorial to draw dynamic waveforms, displaying the sound of the microphone input between two points: the center of the screen and the mouse.

Reactable look-alike =)


First, let's import the minim library


import ddf.minim.*; //import minim

Minim minim;//declare minim

AudioInput in; //declare an input

int bufferSize = 1280; //define the buffer size

int newBufferSize = bufferSize; //declare and initialize the buffer size

void setup(){

  size(700,700); // size of the screen

  minim = new Minim(this); //initialize minim

  in = minim.getLineIn(Minim.MONO, bufferSize);// get a line in from Minim, default bit depth is 16

}

void draw(){

}

And... change variables
The amplitude of the graph will be the spectrum of the input audio wave. We just have to change the values of the amplitude vector for the values of the buffer, which we get with a "for" function that increment till the buffer size -1, and replace the Y component of the vector with (in.left.get()) .


import ddf.minim.*; //import minim
Minim minim;//declare minim
AudioInput in; //declare an input


int bufferSize = 1280; //define the buffer size
int newBufferSize = bufferSize; //declare and initialize the buffer size

void setup(){
  size(700,700,P3D); // size of the screen
  minim = new Minim(this); //initialize minim
  in = minim.getLineIn(Minim.MONO, bufferSize);// get a line in from Minim, default bit depth is 16
  // get a line out from Minim, default sample rate is 44100, default bit depth is 16


}

void draw(){
  
  background(0,0,255);
  
  float startPointX = width/2; //define the X position of the start point in the center of the screen;
  float startPointY = height/2; //define the Y position of the start point in the center of the screen;
  float endPointX=mouseX; //define the X position of the end point that will follow the mouse;
  float endPointY=mouseY; //define the Y position of the end point that will follow the mouse;
  
  
float deltaX=mouseX-width/2; //create a variable with the delta of the x component of the ending - start point
float deltaY=mouseY-height/2; //create a variable with the delta of the y component of the ending - start point
float angleInRadians=atan2(deltaY,deltaX); //get the angle in radians between them with atan2()


  PVector[]points=new PVector[1280]; //create an array of vectors that will store the flat positions of points that will create the graph with the number of elements equal to the size of the of the arraylist 
  PVector[]amplitude = new PVector[1280]; //create an array of vectors that will store the amplitude of the mapped mouse with the number of elements equal to the size of the of the arraylist
  
//initalize each vector with x=0 and y=0 values;
  for(int a=0; a<1280-1; a++){
    points[a] = new PVector(0,0,0);
    amplitude[a] = new PVector(0,0,0);
  }
  
//here the magic begins

//we will create a line made of vertex, and each vertex will receive the values of the vectors

  beginShape();
  noFill(); //no fill
  stroke(255); // black stroke
  strokeWeight(3); //5 px stroke

  for(int i = 0; i<1280-1;i++){

  float X=lerp(startPointX,endPointX,i/float(1280-1)); // create a linear interpolation between the start and the end point of the X component, and the amount of interpolation will cover the entire interval;
  float Y=lerp(startPointY,endPointY,i/float(1280-1));  // create a linear interpolation between the start and the end point of the Y component, and the amount of interpolation will cover the entire interval;
  amplitude[i].set(0,(in.left.get(i)*200),0); //set each vertex of the aray with the amplitude of the graph, acquiring the data of the buffer
  rotate2D(amplitude[i],angleInRadians); //rotate the vector of amplitude acordingly to the angle between the start and end points

  points[i].set(X,Y,0); //set each vertex of the array with the correspondent value of the interpolation, creating a flat line
  points[i].add(amplitude[i]); //add the amplitude vector to the flat line of vectors, creating a 2D graph 
  
  vertex (points[i].x,points[i].y); //draw each vertex with the values (coordinates) of the vertex
  }
  endShape();
  
  //draw the ellipses with the positions of the startpoint and endpoint
  float diam=40;
  fill(255);
  ellipse(startPointX,startPointY,diam,diam);
  ellipse(endPointX,endPointY,diam,diam);
  
}


//A function that rotates the vector

void rotate2D(PVector v, float angle) {
  // What's the magnitude?
  float m = v.mag();
  // What's the angle?
  float a = v.heading2D();
 
  // Change the angle
  a += angle;
 
  // Polar to cartesian for the new xy components
  v.x = m * cos(a);
  v.y = m * sin(a);
}


Monday, November 5, 2012

Dynamic Graphs and Processing

I figured out a simple way to manage graphs in Processing using basically ArrayList, PVector, lerp(); and map(). This method is pretty handy and gives more control to generate graphs.
In this "tutorial" I will show how to create a real time graph that analyses the movement of the mouse, displaying the graph between two defined points (beginning in the center of the screen and following the mouse).
This method can be used to render waveforms following two defined points, or to draw mapped graphs wherever you want to put it in the space of the screen.

Look at the waveforms in the Reactable


I didn't have luck searching for tutorials in order to create and display "controlled" graphs, so, I created a very unique way to solve this problem.

ArrayList.
ArrayList is more flexible than simple arrays to manage data because it's resizable, and the limit of elements is defined by the available memory of the system. If you have to store and analyse an unknown number of elements (Objects, Integers, Floats, Strings, etc), its best to use arraylists. When an element is added, the size of the array increases automatically. It's good to analyse realtime data.

PVector 
PVector is handy because it's possible to think each component of the vector independently. For graphs, you can think each axis of data at time. I used it to rotate real time graphs, like waveforms.

lerp();
Lerp stands for "linear interpolation", and lerp() is a function that make the interpolation between two points. That was the function I used to put de graph wherever I want ( vertical, diagonal, horizontal, backwards). You just specifies where is the beginning point and the end point, and the amount of interpolation in the range of 0 and 1 (0.1 is near to the first point, 0.5 is in the middle and 0.9 is near to the end point). With a "for" function, you achieve an interpolation between any coordinates.

map();
Map() is a function that remaps a number from one range to another. I used this to modify the range of the data in order to resize the graph.

Now, let's put everything together.

Let's start capturing the data.

ArrayList <Float> variation = new ArrayList<Float>(); //Create an ArrayList of floats


void setup(){

  size(400,400); //set the size as 400x400 px

}


void draw (){

  background(200); //set gray background

  float mapMouseXFromCenter = map(mouseX,0,width,-200,200); //create a variable that remaps the X axis of mouse from the range from 0 to width to  the range from -200 to 200: when the mouse is in the 0 position (the left border), the value of the variable is -200, and when the mouse is in the oposite border (width, or 400), the variable is equal to 200


  variation.add (mapMouseXFromCenter); //store the data of the variable (mapped mouse) related to each frame in the arraylist


}
Now, let's display the data


ArrayList <Float> variation = new ArrayList<Float>();


void setup(){

  size(400,400);


}


void draw (){

  background(200);

  float mapMouseXFromCenter=map(mouseX,0,width,-200,200);

  variation.add (mapMouseXFromCenter);


  float startPointX = width/2; //define the X position of the start point in the center of the screen;

  float startPointY = height/2; //define the Y position of the start point in the center of the screen;

  float endPointX=mouseX; //define the X position of the end point that will follow the mouse;

  float endPointY=mouseY; //define the Y position of the end point that will follow the mouse;


  PVector[]points=new PVector[variation.size()]; //create an array of vectors that will store the flat positions of points that will create the graph with the number of elements equal to the size of the of the arraylist

  PVector[]amplitude = new PVector[variation.size()]; //create an array of vectors that will store the amplitude of the mapped mouse with the number of elements equal to the size of the of the arraylist


//initalize every vectors with x=0 and y=0 values;

  for(int a=0; a<variation.size()-1; a++){

    points[a] = new PVector(0,0);

    amplitude[a] = new PVector(0,0);

  }


//here the magic begins


//we will create a line made of vertex, and each vertex will receive the values of the vectors


  beginShape();

  noFill(); //no fill

  stroke(0); // black stroke

  strokeWeight(5); //5 px stroke


  for(int i = 0; i<variation.size()-1;i++){


  float X=lerp(startPointX,endPointX,i/float(variation.size()-1)); // create a linear interpolation between the start and the end point of the X component, and the amount of interpolation will cover the entire interval;

  float Y=lerp(startPointY,endPointY,i/float(variation.size()-1));  // create a linear interpolation between the start and the end point of the Y component, and the amount of interpolation will cover the entire interval;


  points[i].set(X,Y,0); //set each vertex of the array with the correspondent value of the interpolation, creating a flat line

  amplitude[i].set(0,variation.get(i),0); //set each vertex of the aray with the amplitude of the graph, acquiring the data of each element of the arraylist

  points[i].add(amplitude[i]); //add the amplitude vector to the flat line of vectors, creating a 2D graph


  vertex (points[i].x,points[i].y); //draw each vertex with the values (coordinates) of the vertex

  }

  endShape();


}
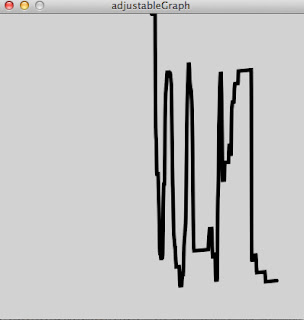
Try to copy and run this code to see what happens. Now we have the graph right where we intend to: starts in the middle of the screen and follow the mouse. But, the graph doesn't rotates accordingly to the mouse.
When the mouse is under the start point, the graph distorts to a straight line
Rotating Vectors
In order to achieve the rotation we need, we will need to rotate the amplitude vector accordingly to the angle between the start and the end points of the graph.

ArrayList <Float> variation = new ArrayList<Float>(); 


void setup(){
  size(400,400,P3D);
  
}

void draw (){
  background(200);
  float mapMouseXFromCenter=map(mouseX,0,width,-200,200);
  float mapMouseYFromCenter=map(mouseY,0,height,-200,200);
  variation.add (mapMouseXFromCenter);
  
  float startPointX = width/2; //define the X position of the start point in the center of the screen;
  float startPointY = height/2; //define the Y position of the start point in the center of the screen;
  float endPointX=mouseX; //define the X position of the end point that will follow the mouse;
  float endPointY=mouseY; //define the Y position of the end point that will follow the mouse;
  
  PVector[]points=new PVector[variation.size()]; //create an array of vectors that will store the flat positions of points that will create the graph with the number of elements equal to the size of the of the arraylist 
  PVector[]amplitude = new PVector[variation.size()]; //create an array of vectors that will store the amplitude of the mapped mouse with the number of elements equal to the size of the of the arraylist
  
//initalize every vectors with x=0 and y=0 values;
  for(int a=0; a<variation.size()-1; a++){
    points[a] = new PVector(0,0,0);
    amplitude[a] = new PVector(0,0,0);
  }
//rotating the vectors

float deltaX=mouseX-width/2; //create a variable with the delta of the x component of the ending - start point
float deltaY=mouseY-height/2; //create a variable with the delta of the y component of the ending - start point
float angleInRadians=atan2(deltaY,deltaX); //get the angle in radians between them with atan2()


//here the magic begins

//we will create a line made of vertex, and each vertex will receive the values of the vectors

  beginShape();
  noFill(); //no fill
  stroke(0); // black stroke
  strokeWeight(5); //5 px stroke

  for(int i = 0; i<variation.size()-1;i++){

  float X=lerp(startPointX,endPointX,i/float(variation.size()-1)); // create a linear interpolation between the start and the end point of the X component, and the amount of interpolation will cover the entire interval;
  float Y=lerp(startPointY,endPointY,i/float(variation.size()-1));  // create a linear interpolation between the start and the end point of the Y component, and the amount of interpolation will cover the entire interval;

  points[i].set(X,Y,0); //set each vertex of the array with the correspondent value of the interpolation, creating a flat line
  amplitude[i].set(0,variation.get(i),0); //set each vertex of the aray with the amplitude of the graph, acquiring the data of each element of the arraylist
  rotate2D(amplitude[i],angleInRadians); //rotate the vector of amplitude acordingly to the angle between the start and end points
  points[i].add(amplitude[i]); //add the amplitude vector to the flat line of vectors, creating a 2D graph 
  
  vertex (points[i].x,points[i].y); //draw each vertex with the values (coordinates) of the vertex
  }
  endShape();
  if(frameCount%1000==0){
    for(int j=0; j<variation.size()-1;j++){
    variation.remove(j);
    }
  }
  
}

//A function that rotates the vector

void rotate2D(PVector v, float angle) {
  // What's the magnitude?
  float m = v.mag();
  // What's the angle?
  float a = v.heading2D();
 
  // Change the angle
  a += angle;
 
  // Polar to cartesian for the new xy components
  v.x = m * cos(a);
  v.y = m * sin(a);
}
The intended result:
The graph is dynamically drawn wherever we want
With this method, we have complete control to the graph, defining beginning  and ending points, amplitude, rotation and where the graph is rendered. With the values of the resultant vector (points[i].x and points[i].y) we can make any graph we need.
Bonus: 3D graph
Adding the third dimention of the graph makes a very unusual representation of data (just by adding the Z component (the mapped mouseY). With this, we have 3 dimensions of data: time, mouseX and mouseY;


ArrayList <Float> variation = new ArrayList<Float>(); 
ArrayList <Float> Z=new ArrayList<Float>();


void setup(){
  size(400,400,P3D);
  
}

void draw (){
  background(200);
  float mapMouseXFromCenter=map(mouseX,0,width,-200,200);
  float mapMouseYFromCenter=map(mouseY,0,height,-200,200);
  variation.add (mapMouseXFromCenter);
  Z.add(mapMouseYFromCenter);
  
  float startPointX = width/2; //define the X position of the start point in the center of the screen;
  float startPointY = height/2; //define the Y position of the start point in the center of the screen;
  float endPointX=mouseX; //define the X position of the end point that will follow the mouse;
  float endPointY=mouseY; //define the Y position of the end point that will follow the mouse;
  
  PVector[]points=new PVector[variation.size()]; //create an array of vectors that will store the flat positions of points that will create the graph with the number of elements equal to the size of the of the arraylist 
  PVector[]amplitude = new PVector[variation.size()]; //create an array of vectors that will store the amplitude of the mapped mouse with the number of elements equal to the size of the of the arraylist
  
//initalize every vectors with x=0 and y=0 values;
  for(int a=0; a<variation.size()-1; a++){
    points[a] = new PVector(0,0,0);
    amplitude[a] = new PVector(0,0,0);
  }
//rotating the vectors

float deltaX=mouseX-width/2; //create a variable with the delta of the x component of the ending - start point
float deltaY=mouseY-height/2; //create a variable with the delta of the y component of the ending - start point
float angleInRadians=atan2(deltaY,deltaX); //get the angle in radians between them with atan2()


//here the magic begins

//we will create a line made of vertex, and each vertex will receive the values of the vectors

  beginShape();
  noFill(); //no fill
  stroke(0); // black stroke
  strokeWeight(5); //5 px stroke

  for(int i = 0; i<variation.size()-1;i++){

  float X=lerp(startPointX,endPointX,i/float(variation.size()-1)); // create a linear interpolation between the start and the end point of the X component, and the amount of interpolation will cover the entire interval;
  float Y=lerp(startPointY,endPointY,i/float(variation.size()-1));  // create a linear interpolation between the start and the end point of the Y component, and the amount of interpolation will cover the entire interval;

  points[i].set(X,Y,0); //set each vertex of the array with the correspondent value of the interpolation, creating a flat line
  amplitude[i].set(0,variation.get(i),Z.get(i)); //set each vertex of the aray with the amplitude of the graph, acquiring the data of each element of the arraylist
  rotate2D(amplitude[i],angleInRadians); //rotate the vector of amplitude acordingly to the angle between the start and end points
  points[i].add(amplitude[i]); //add the amplitude vector to the flat line of vectors, creating a 2D graph 
  
  vertex (points[i].x,points[i].y); //draw each vertex with the values (coordinates) of the vertex
  }
  endShape();
  if(frameCount%1000==0){
    for(int j=0; j<variation.size()-1;j++){
    variation.remove(j);
    Z.remove(j);
    }
  }
  
}

//A function that rotates the vector

void rotate2D(PVector v, float angle) {
  // What's the magnitude?
  float m = v.mag();
  // What's the angle?
  float a = v.heading2D();

  // Change the angle
  a += angle;

  // Polar to cartesian for the new xy components
  v.x = m * cos(a);
  v.y = m * sin(a);
}


Next, I'll show how to render a waveform capturing the data from a microphone using minim.

Sunday, October 21, 2012

Posting

I'm very busy these days and I have no hope that this will change anytime soon. I'll try to post with regularity, but I can't assure it... Sorry... :(

Collective face

According with the philosopher Levinas, the concept of face is applicable only to humans. But, if we could analyse the whole internet as a collective human face?
The internet is a acentric rhisomatic web that is expanding, but it's limited. It is a matted web in which the linked points are partially formed by proposed source codes and by rearrangement or addition of code. Internet is a medium, a language and a situation. Strictly speaking, internet is a huge set of data open to modification arising from any part of the web, and it's a place where the source code is modified and expanded accordingly with the users activity. It's a finite web that could be analysed. It's possible (with the correct method) to measure whole humanity as an single individual. It's possible to measure the macro-humor of the internet in a determined moment, evaluate if the internet is being creative or not. This way, i think the internet is like a collective face.