Monday, November 26, 2012

Processing glitch camera


<Running with Processing 1.5.1!!>


//glitch camera still generator
//click to save image
 
import processing.video.*;
 
Capture cam;
 
int N=0;
 
void setup(){
size (851,315);
background(255);
colorMode(HSB);
 
 
// If no device is specified, will just use the default.
  cam = new Capture(this, 851, 315);
 
  // To use another device (i.e. if the default device causes an error),  
  // list all available capture devices to the console to find your camera.
  //String[] devices = Capture.list();
  //println(devices);
   
  // Change devices[0] to the proper index for your camera.
  //cam = new Capture(this, width, height, devices[0]);
 
  // Opens the settings page for this capture device.
  //camera.settings();
}
 
void draw(){
 
  Set();
    if (cam.available() == true) {
      if(frameCount==2||frameCount%150==0){
    cam.read();
    image(cam, 0, 0);
    // The following does the same, and is faster when just drawing the image
    // without any additional resizing, transformations, or tint.
    set(width, height, cam);
     for (int i=0; i<100;i++){
       noStroke();
    fill(random(0,360),300,300,100);
    rect ((random (0, width)),(random (0, height)),(random (0,50)),(random(0,50)));
    
  }
      }
  }


}
 
int r(int a){
  return int(random(a));
}
 
void mouseReleased (){
  N++;
  save("glitchCamera"+ (N)+".tif");
}
 
void Set() {
  for (int i=0; i<10; i++) {
    int x = r(width);
    int y = r(height);
    set(x+r(50)-1,y+r(3)-1,get(x,y,r(99),r(30)));
  }
}

Sunday, November 25, 2012

Facebook glitch cover generator made with Processing

//FaceBook glitch cover generator
//click to save image

int N=0;

void setup(){
size (851,315);
background(255);
}

void draw(){
  
  Set();
  Glitch(); 

}

int r(int a){
  return int(random(a));
}

void mouseReleased (){
  N++;
  save("glitchCover"+ (N)+".tif");
}

void Set() {
  for (int i=0; i<10; i++) {
    int x = r(width);
    int y = r(height);
    set(x+r(50)-1,y+r(3)-1,get(x,y,r(99),r(30)));
  }
}

void Glitch() {
  if (frameCount%(r(250)+1) == 0) {
    int lineDensity = int(noise(frameCount)*width);
    for (int i=0; i<width*1.5; i+=lineDensity) {
      stroke(random(0, 255),random(0, 255),random(0, 255));
      strokeWeight(random(1,50));
      line(-100,i,i,-100);
    }
  }
}

Thursday, November 8, 2012

Midi to waveform representation in Processing


Here I'll show how to convert midi notes to frequency, and how to show that frequency with a sine wave


//click on the note numbers to get the respective frequency 
  
float hertz;
  
int noteNumber;//variable for the midi note
  
int xspacing = 5;   // How far apart should each horizontal location be spaced
  
int w;              // Width of entire wave


int theta = 0;  // Start angle at 0
  
float ampl;  // Height of wave
  
float period = 100.0;  // How many pixels before the wave repeats
  
float dx;  // Value for incrementing X, a function of period and xspacing
  
float[] yvalues;  // Using an array to store height values for the wave


void setup() {
  
  size(640, 360);
  
  w = width+16;
  
  dx = (TWO_PI / period) * xspacing;
  
  yvalues = new float[w/xspacing];
  
}


void draw() {
  
  background(0,0,255);


  float startPointX = width/2; //define the X position of the start point in the center of the screen;
  
  float startPointY = height/2; //define the Y position of the start point in the center of the screen;
  
  float endPointX=mouseX; //define the X position of the end point that will follow the mouse;
  
  float endPointY=mouseY; //define the Y position of the end point that will follow the mouse;


  float deltaX=mouseX-width/2; //create a variable with the delta of the x component of the ending - start point
  
  float deltaY=mouseY-height/2; //create a variable with the delta of the y component of the ending - start point
  
  float angleInRadians=atan2(deltaY,deltaX); //get the angle in radians between them with atan2()


  PVector[]points=new PVector[100]; //create an array of vectors that will store the flat positions of points that will create the graph with the number of elements equal to the size of the of the arraylist
  
  PVector[]amplitude = new PVector[100]; //create an array of vectors that will store the amplitude of the mapped mouse with the number of elements equal to the size of the of the arraylist


//initalize each vector with x=0 and y=0 values;
  
  for(int a=0; a<100-1; a++){
  
    points[a] = new PVector(0,0,0);
  
    amplitude[a] = new PVector(0,0,0);
  
  }


  //here the magic begins


//we will create a line made of vertex, and each vertex will receive the values of the vectors


textSize(28);
  
fill(255);
  
text("60",30,40);
text("69",width-60,40);
text("100",30,height-40);
text("127",width-60,height-40);
  
text("hertz "+hertz,width-300,height/2+100);


if(mousePressed){
  
  if((mouseX>10&&mouseX<50) && (mouseY>10&&mouseY<60)){
  
    noteNumber=60;
  
  }
  
  if((mouseX>width-80&&mouseX<width) && (mouseY>10&&mouseY<60)){
  
    noteNumber=69;
  
  }
  
   if((mouseX>10&&mouseX<50) && (mouseY>height-70&&mouseY<height)){
  
    noteNumber=100;
  
  }
  
    if((mouseX>width-80&&mouseX<width) && (mouseY>height-70&&mouseY<height)){
  
    noteNumber=127;
  
  }
  
  
}
  
println("noteNumber "+ noteNumber);
  
//convert midi to frequency
  
    
hertz = ( 440*pow(2,((noteNumber-69)/12.0))) ;
println("hertz "+ hertz);


  ampl=20;//aplitude of 20px


  // For every x value, calculate a y value with sine function


  for (int i = 0; i < 100-1; i++) {
 
    
    theta += int(hertz);
   theta+=int(dx);
   if(theta%1000==0){//reset theta
     theta=0;
   }
   
    yvalues[i] = sin(theta)*ampl;
  
   println(theta);  
  
  }


  beginShape();
  
  noFill(); //no fill
  
  stroke(255); // white stroke
  
  strokeWeight(2); //2 px stroke


  for(int i = 0; i<100-1;i++){


  float X=lerp(startPointX,endPointX,i/float(99)); // create a linear interpolation between the start and the end point of the X component, and the amount of interpolation will cover the entire interval;
  
  float Y=lerp(startPointY,endPointY,i/float(99));  // create a linear interpolation between the start and the end point of the Y component, and the amount of interpolation will cover the entire interval;
  
  amplitude[i].set(0,(yvalues[i]),0); //set each vertex of the aray with the amplitude of the graph, acquiring the data of the buffer
  
  rotate2D(amplitude[i],angleInRadians); //rotate the vector of amplitude acordingly to the angle between the start and end points


  points[i].set(X,Y,0); //set each vertex of the array with the correspondent value of the interpolation, creating a flat line
  
  points[i].add(amplitude[i]); //add the amplitude vector to the flat line of vectors, creating a 2D graph


  vertex (points[i].x,points[i].y); //draw each vertex with the values (coordinates) of the vertex
  
  }
  
  endShape();


  //draw the ellipses with the positions of the startpoint and endpoint
  
  float diam=40;
  
  fill(255);
  
  ellipse(startPointX,startPointY,diam,diam);
  
  ellipse(endPointX,endPointY,diam,diam);


}
  
  
//A function that rotates the vector


void rotate2D(PVector v, float angle) {
  
  // What's the magnitude?
  
  float m = v.mag();
  
  // What's the angle?
  
  float a = v.heading2D();


  // Change the angle
  
  a += angle;


  // Polar to cartesian for the new xy components
  
  v.x = m * cos(a);
  
  v.y = m * sin(a);
  
}

Tuesday, November 6, 2012

Dynamic waveform representation in Processing

I'll show how to use the method of the previous tutorial to draw dynamic waveforms, displaying the sound of the microphone input between two points: the center of the screen and the mouse.

Reactable look-alike =)


First, let's import the minim library


import ddf.minim.*; //import minim

Minim minim;//declare minim

AudioInput in; //declare an input

int bufferSize = 1280; //define the buffer size

int newBufferSize = bufferSize; //declare and initialize the buffer size

void setup(){

  size(700,700); // size of the screen

  minim = new Minim(this); //initialize minim

  in = minim.getLineIn(Minim.MONO, bufferSize);// get a line in from Minim, default bit depth is 16

}

void draw(){

}

And... change variables
The amplitude of the graph will be the spectrum of the input audio wave. We just have to change the values of the amplitude vector for the values of the buffer, which we get with a "for" function that increment till the buffer size -1, and replace the Y component of the vector with (in.left.get()) .


import ddf.minim.*; //import minim
Minim minim;//declare minim
AudioInput in; //declare an input


int bufferSize = 1280; //define the buffer size
int newBufferSize = bufferSize; //declare and initialize the buffer size

void setup(){
  size(700,700,P3D); // size of the screen
  minim = new Minim(this); //initialize minim
  in = minim.getLineIn(Minim.MONO, bufferSize);// get a line in from Minim, default bit depth is 16
  // get a line out from Minim, default sample rate is 44100, default bit depth is 16


}

void draw(){
  
  background(0,0,255);
  
  float startPointX = width/2; //define the X position of the start point in the center of the screen;
  float startPointY = height/2; //define the Y position of the start point in the center of the screen;
  float endPointX=mouseX; //define the X position of the end point that will follow the mouse;
  float endPointY=mouseY; //define the Y position of the end point that will follow the mouse;
  
  
float deltaX=mouseX-width/2; //create a variable with the delta of the x component of the ending - start point
float deltaY=mouseY-height/2; //create a variable with the delta of the y component of the ending - start point
float angleInRadians=atan2(deltaY,deltaX); //get the angle in radians between them with atan2()


  PVector[]points=new PVector[1280]; //create an array of vectors that will store the flat positions of points that will create the graph with the number of elements equal to the size of the of the arraylist 
  PVector[]amplitude = new PVector[1280]; //create an array of vectors that will store the amplitude of the mapped mouse with the number of elements equal to the size of the of the arraylist
  
//initalize each vector with x=0 and y=0 values;
  for(int a=0; a<1280-1; a++){
    points[a] = new PVector(0,0,0);
    amplitude[a] = new PVector(0,0,0);
  }
  
//here the magic begins

//we will create a line made of vertex, and each vertex will receive the values of the vectors

  beginShape();
  noFill(); //no fill
  stroke(255); // black stroke
  strokeWeight(3); //5 px stroke

  for(int i = 0; i<1280-1;i++){

  float X=lerp(startPointX,endPointX,i/float(1280-1)); // create a linear interpolation between the start and the end point of the X component, and the amount of interpolation will cover the entire interval;
  float Y=lerp(startPointY,endPointY,i/float(1280-1));  // create a linear interpolation between the start and the end point of the Y component, and the amount of interpolation will cover the entire interval;
  amplitude[i].set(0,(in.left.get(i)*200),0); //set each vertex of the aray with the amplitude of the graph, acquiring the data of the buffer
  rotate2D(amplitude[i],angleInRadians); //rotate the vector of amplitude acordingly to the angle between the start and end points

  points[i].set(X,Y,0); //set each vertex of the array with the correspondent value of the interpolation, creating a flat line
  points[i].add(amplitude[i]); //add the amplitude vector to the flat line of vectors, creating a 2D graph 
  
  vertex (points[i].x,points[i].y); //draw each vertex with the values (coordinates) of the vertex
  }
  endShape();
  
  //draw the ellipses with the positions of the startpoint and endpoint
  float diam=40;
  fill(255);
  ellipse(startPointX,startPointY,diam,diam);
  ellipse(endPointX,endPointY,diam,diam);
  
}


//A function that rotates the vector

void rotate2D(PVector v, float angle) {
  // What's the magnitude?
  float m = v.mag();
  // What's the angle?
  float a = v.heading2D();
 
  // Change the angle
  a += angle;
 
  // Polar to cartesian for the new xy components
  v.x = m * cos(a);
  v.y = m * sin(a);
}


Monday, November 5, 2012

Dynamic Graphs and Processing

I figured out a simple way to manage graphs in Processing using basically ArrayList, PVector, lerp(); and map(). This method is pretty handy and gives more control to generate graphs.
In this "tutorial" I will show how to create a real time graph that analyses the movement of the mouse, displaying the graph between two defined points (beginning in the center of the screen and following the mouse).
This method can be used to render waveforms following two defined points, or to draw mapped graphs wherever you want to put it in the space of the screen.

Look at the waveforms in the Reactable


I didn't have luck searching for tutorials in order to create and display "controlled" graphs, so, I created a very unique way to solve this problem.

ArrayList.
ArrayList is more flexible than simple arrays to manage data because it's resizable, and the limit of elements is defined by the available memory of the system. If you have to store and analyse an unknown number of elements (Objects, Integers, Floats, Strings, etc), its best to use arraylists. When an element is added, the size of the array increases automatically. It's good to analyse realtime data.

PVector 
PVector is handy because it's possible to think each component of the vector independently. For graphs, you can think each axis of data at time. I used it to rotate real time graphs, like waveforms.

lerp();
Lerp stands for "linear interpolation", and lerp() is a function that make the interpolation between two points. That was the function I used to put de graph wherever I want ( vertical, diagonal, horizontal, backwards). You just specifies where is the beginning point and the end point, and the amount of interpolation in the range of 0 and 1 (0.1 is near to the first point, 0.5 is in the middle and 0.9 is near to the end point). With a "for" function, you achieve an interpolation between any coordinates.

map();
Map() is a function that remaps a number from one range to another. I used this to modify the range of the data in order to resize the graph.

Now, let's put everything together.

Let's start capturing the data.

ArrayList <Float> variation = new ArrayList<Float>(); //Create an ArrayList of floats


void setup(){

  size(400,400); //set the size as 400x400 px

}


void draw (){

  background(200); //set gray background

  float mapMouseXFromCenter = map(mouseX,0,width,-200,200); //create a variable that remaps the X axis of mouse from the range from 0 to width to  the range from -200 to 200: when the mouse is in the 0 position (the left border), the value of the variable is -200, and when the mouse is in the oposite border (width, or 400), the variable is equal to 200


  variation.add (mapMouseXFromCenter); //store the data of the variable (mapped mouse) related to each frame in the arraylist


}
Now, let's display the data


ArrayList <Float> variation = new ArrayList<Float>();


void setup(){

  size(400,400);


}


void draw (){

  background(200);

  float mapMouseXFromCenter=map(mouseX,0,width,-200,200);

  variation.add (mapMouseXFromCenter);


  float startPointX = width/2; //define the X position of the start point in the center of the screen;

  float startPointY = height/2; //define the Y position of the start point in the center of the screen;

  float endPointX=mouseX; //define the X position of the end point that will follow the mouse;

  float endPointY=mouseY; //define the Y position of the end point that will follow the mouse;


  PVector[]points=new PVector[variation.size()]; //create an array of vectors that will store the flat positions of points that will create the graph with the number of elements equal to the size of the of the arraylist

  PVector[]amplitude = new PVector[variation.size()]; //create an array of vectors that will store the amplitude of the mapped mouse with the number of elements equal to the size of the of the arraylist


//initalize every vectors with x=0 and y=0 values;

  for(int a=0; a<variation.size()-1; a++){

    points[a] = new PVector(0,0);

    amplitude[a] = new PVector(0,0);

  }


//here the magic begins


//we will create a line made of vertex, and each vertex will receive the values of the vectors


  beginShape();

  noFill(); //no fill

  stroke(0); // black stroke

  strokeWeight(5); //5 px stroke


  for(int i = 0; i<variation.size()-1;i++){


  float X=lerp(startPointX,endPointX,i/float(variation.size()-1)); // create a linear interpolation between the start and the end point of the X component, and the amount of interpolation will cover the entire interval;

  float Y=lerp(startPointY,endPointY,i/float(variation.size()-1));  // create a linear interpolation between the start and the end point of the Y component, and the amount of interpolation will cover the entire interval;


  points[i].set(X,Y,0); //set each vertex of the array with the correspondent value of the interpolation, creating a flat line

  amplitude[i].set(0,variation.get(i),0); //set each vertex of the aray with the amplitude of the graph, acquiring the data of each element of the arraylist

  points[i].add(amplitude[i]); //add the amplitude vector to the flat line of vectors, creating a 2D graph


  vertex (points[i].x,points[i].y); //draw each vertex with the values (coordinates) of the vertex

  }

  endShape();


}
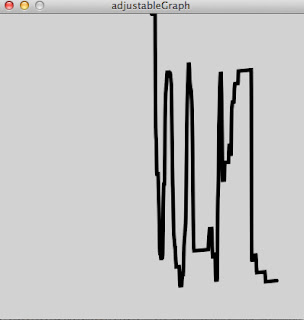
Try to copy and run this code to see what happens. Now we have the graph right where we intend to: starts in the middle of the screen and follow the mouse. But, the graph doesn't rotates accordingly to the mouse.
When the mouse is under the start point, the graph distorts to a straight line
Rotating Vectors
In order to achieve the rotation we need, we will need to rotate the amplitude vector accordingly to the angle between the start and the end points of the graph.

ArrayList <Float> variation = new ArrayList<Float>(); 


void setup(){
  size(400,400,P3D);
  
}

void draw (){
  background(200);
  float mapMouseXFromCenter=map(mouseX,0,width,-200,200);
  float mapMouseYFromCenter=map(mouseY,0,height,-200,200);
  variation.add (mapMouseXFromCenter);
  
  float startPointX = width/2; //define the X position of the start point in the center of the screen;
  float startPointY = height/2; //define the Y position of the start point in the center of the screen;
  float endPointX=mouseX; //define the X position of the end point that will follow the mouse;
  float endPointY=mouseY; //define the Y position of the end point that will follow the mouse;
  
  PVector[]points=new PVector[variation.size()]; //create an array of vectors that will store the flat positions of points that will create the graph with the number of elements equal to the size of the of the arraylist 
  PVector[]amplitude = new PVector[variation.size()]; //create an array of vectors that will store the amplitude of the mapped mouse with the number of elements equal to the size of the of the arraylist
  
//initalize every vectors with x=0 and y=0 values;
  for(int a=0; a<variation.size()-1; a++){
    points[a] = new PVector(0,0,0);
    amplitude[a] = new PVector(0,0,0);
  }
//rotating the vectors

float deltaX=mouseX-width/2; //create a variable with the delta of the x component of the ending - start point
float deltaY=mouseY-height/2; //create a variable with the delta of the y component of the ending - start point
float angleInRadians=atan2(deltaY,deltaX); //get the angle in radians between them with atan2()


//here the magic begins

//we will create a line made of vertex, and each vertex will receive the values of the vectors

  beginShape();
  noFill(); //no fill
  stroke(0); // black stroke
  strokeWeight(5); //5 px stroke

  for(int i = 0; i<variation.size()-1;i++){

  float X=lerp(startPointX,endPointX,i/float(variation.size()-1)); // create a linear interpolation between the start and the end point of the X component, and the amount of interpolation will cover the entire interval;
  float Y=lerp(startPointY,endPointY,i/float(variation.size()-1));  // create a linear interpolation between the start and the end point of the Y component, and the amount of interpolation will cover the entire interval;

  points[i].set(X,Y,0); //set each vertex of the array with the correspondent value of the interpolation, creating a flat line
  amplitude[i].set(0,variation.get(i),0); //set each vertex of the aray with the amplitude of the graph, acquiring the data of each element of the arraylist
  rotate2D(amplitude[i],angleInRadians); //rotate the vector of amplitude acordingly to the angle between the start and end points
  points[i].add(amplitude[i]); //add the amplitude vector to the flat line of vectors, creating a 2D graph 
  
  vertex (points[i].x,points[i].y); //draw each vertex with the values (coordinates) of the vertex
  }
  endShape();
  if(frameCount%1000==0){
    for(int j=0; j<variation.size()-1;j++){
    variation.remove(j);
    }
  }
  
}

//A function that rotates the vector

void rotate2D(PVector v, float angle) {
  // What's the magnitude?
  float m = v.mag();
  // What's the angle?
  float a = v.heading2D();
 
  // Change the angle
  a += angle;
 
  // Polar to cartesian for the new xy components
  v.x = m * cos(a);
  v.y = m * sin(a);
}
The intended result:
The graph is dynamically drawn wherever we want
With this method, we have complete control to the graph, defining beginning  and ending points, amplitude, rotation and where the graph is rendered. With the values of the resultant vector (points[i].x and points[i].y) we can make any graph we need.
Bonus: 3D graph
Adding the third dimention of the graph makes a very unusual representation of data (just by adding the Z component (the mapped mouseY). With this, we have 3 dimensions of data: time, mouseX and mouseY;


ArrayList <Float> variation = new ArrayList<Float>(); 
ArrayList <Float> Z=new ArrayList<Float>();


void setup(){
  size(400,400,P3D);
  
}

void draw (){
  background(200);
  float mapMouseXFromCenter=map(mouseX,0,width,-200,200);
  float mapMouseYFromCenter=map(mouseY,0,height,-200,200);
  variation.add (mapMouseXFromCenter);
  Z.add(mapMouseYFromCenter);
  
  float startPointX = width/2; //define the X position of the start point in the center of the screen;
  float startPointY = height/2; //define the Y position of the start point in the center of the screen;
  float endPointX=mouseX; //define the X position of the end point that will follow the mouse;
  float endPointY=mouseY; //define the Y position of the end point that will follow the mouse;
  
  PVector[]points=new PVector[variation.size()]; //create an array of vectors that will store the flat positions of points that will create the graph with the number of elements equal to the size of the of the arraylist 
  PVector[]amplitude = new PVector[variation.size()]; //create an array of vectors that will store the amplitude of the mapped mouse with the number of elements equal to the size of the of the arraylist
  
//initalize every vectors with x=0 and y=0 values;
  for(int a=0; a<variation.size()-1; a++){
    points[a] = new PVector(0,0,0);
    amplitude[a] = new PVector(0,0,0);
  }
//rotating the vectors

float deltaX=mouseX-width/2; //create a variable with the delta of the x component of the ending - start point
float deltaY=mouseY-height/2; //create a variable with the delta of the y component of the ending - start point
float angleInRadians=atan2(deltaY,deltaX); //get the angle in radians between them with atan2()


//here the magic begins

//we will create a line made of vertex, and each vertex will receive the values of the vectors

  beginShape();
  noFill(); //no fill
  stroke(0); // black stroke
  strokeWeight(5); //5 px stroke

  for(int i = 0; i<variation.size()-1;i++){

  float X=lerp(startPointX,endPointX,i/float(variation.size()-1)); // create a linear interpolation between the start and the end point of the X component, and the amount of interpolation will cover the entire interval;
  float Y=lerp(startPointY,endPointY,i/float(variation.size()-1));  // create a linear interpolation between the start and the end point of the Y component, and the amount of interpolation will cover the entire interval;

  points[i].set(X,Y,0); //set each vertex of the array with the correspondent value of the interpolation, creating a flat line
  amplitude[i].set(0,variation.get(i),Z.get(i)); //set each vertex of the aray with the amplitude of the graph, acquiring the data of each element of the arraylist
  rotate2D(amplitude[i],angleInRadians); //rotate the vector of amplitude acordingly to the angle between the start and end points
  points[i].add(amplitude[i]); //add the amplitude vector to the flat line of vectors, creating a 2D graph 
  
  vertex (points[i].x,points[i].y); //draw each vertex with the values (coordinates) of the vertex
  }
  endShape();
  if(frameCount%1000==0){
    for(int j=0; j<variation.size()-1;j++){
    variation.remove(j);
    Z.remove(j);
    }
  }
  
}

//A function that rotates the vector

void rotate2D(PVector v, float angle) {
  // What's the magnitude?
  float m = v.mag();
  // What's the angle?
  float a = v.heading2D();

  // Change the angle
  a += angle;

  // Polar to cartesian for the new xy components
  v.x = m * cos(a);
  v.y = m * sin(a);
}


Next, I'll show how to render a waveform capturing the data from a microphone using minim.